Graphs of WSY: my comment.
RN I am noting 3 graphs getting on my E-mail thanks relize.
Fig.1. US-China export\impost (2000-2019).
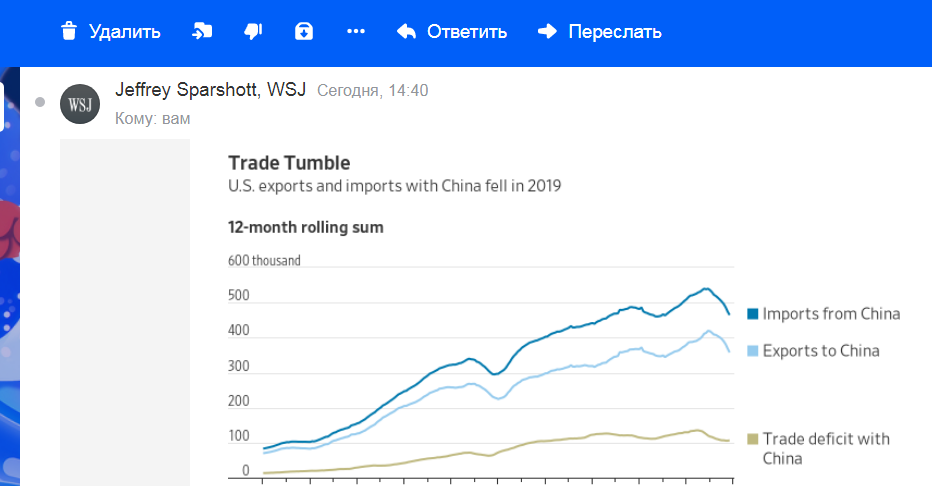
Fig.2. US manufcturing job-opening.
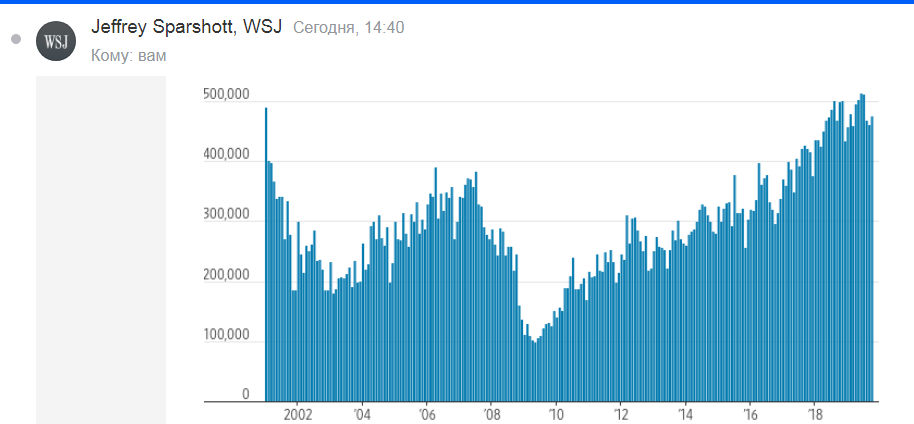
If we comparisond gr.1 & 2 we can see failre on the 2010 datas. It was crisic/
Fig.3. Expextation of inlation of cosumers.
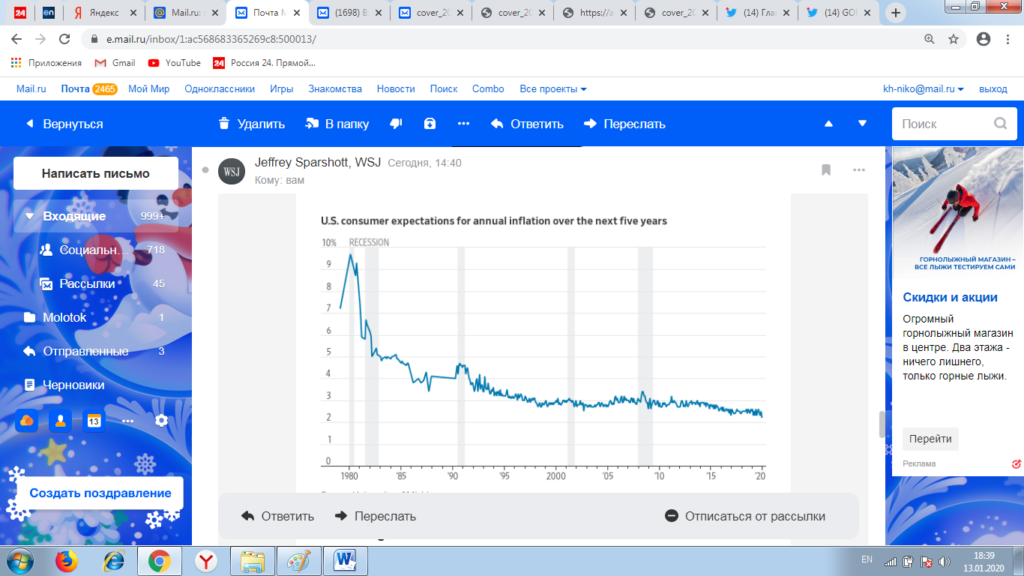
Thr third Gr. not need on coment.
ThU.
Categories: Без рубрики
Comments
So empty here ... leave a comment!